[MORE UPDATES]Performance Issue On Boot Up,,, AND Event Comments, intended?

Iv been complaining about some performance inconsistancies in gdevelop for a bit now, i tried researching it and working it out, i improved my events and all that jazz people tell you to do but the performance issues still happen, specially on boot up.

I finally cought the hole thing! From having weird FPS going all over with close to nothing running, to then it just starting to work properly and having solid FPS with all events running.

For clarification:

  • Some times on booting up GDevelop, the software runs sluggish, poor performance and even freezing or crashing from time to time.

  • Waiting a little time after the first boot and then restarting the engine fixes the issue… mostly.

  • On the video below i actually cought it happening, it was being sluggish, poor performance, then i closed it, re-opened GDevelop and it starting working properly for the most part.

  • Empty Events and Event Comments or “Markers” have a big impact on performance (Below theres the video of me showing this)

  • I took the time to test just how much performance was in the comments and empty or disabled events, i deleted every single one in my event sheet, over 100 comments easely… the result was massive improvement, so far… who knows, performance is kinda all over, so it could go down tomorrow, i did still manage to see a new low of 8.50ms total, wen the lowest before was around 10.50 to 11.00ms when it was running really well (OR SO I THOUGHT, the next morning the performance was back to being bad…)

  • NEW UPDATE! Performance means nothing, last night everything was fine after spending the entire day working on performance, this morning it went back to high total “ms” and having the FPS go all over the place, this is an engine issue end of. Maybe its because of the updates to bring the engine to 3D? Idk man this just aint right, i dont know what else to do

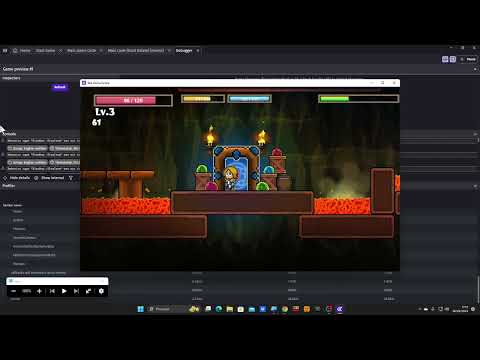
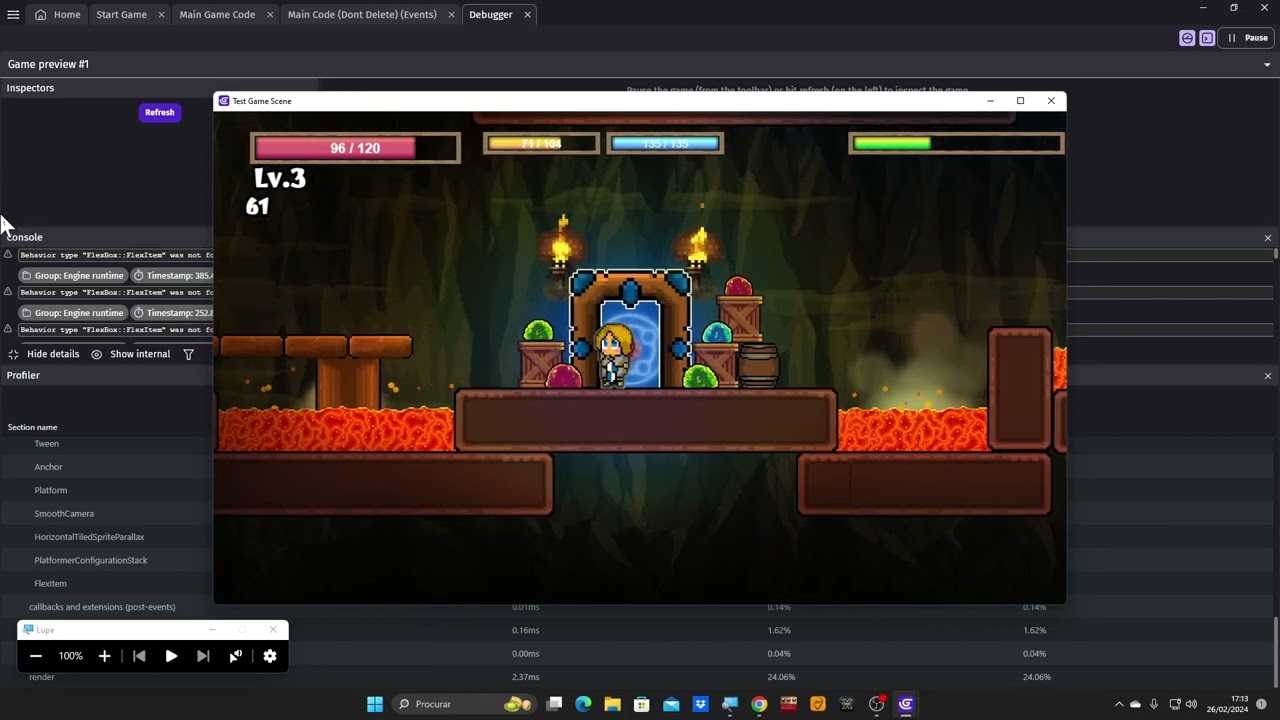
This is the most recent testing with Task Manager showing so you can follow along the performance as i play test

Heres the new video of the testing

This makes no sense to me, maybe someone can shine a light on what iv been experiencing… heres the whole thing in video

This video has the testing with the Event Comments and Empty Events

This video has the performance improving after restarting GDevelop

I know its a bit long and tedious to watch, but please watch it trough so you can see it happen.

Is this just my computer or windows? Or is it something on GDevelop?

ALSO… Someone was complaining about how some times they stop being able to edit their events or something… and since the update before this one, iv been having this kind of crash.

Im editing the events and GDevelop just crashes, or better yet everything freezes, you can still clike the cross to exit but it wont even prompt you if your sure about exiting the software, its weird, could it have something to do with this too?

If i recall correctly, this kind of crash always happens near a boot as well, so it could be related.

Hope this help!

Let me know if theres something i can do.
Clarification: I use version 5.3.185 of Gdevelop.
I don’t know if it helps, but I have noticed several times that when running the profiler in the debuguer, the performance is sometimes lower (generally when you just restart Gdevelop, the values ​​are better). Another thing I noticed, I recently exported a build for android and the performance was noticeably lower. I thought I had done something wrong. I installed a previous build and it worked with the same performance as always (I didn’t restart or modify anything on the phone). I reinstalled the build that had lower performance and it again worked with poor performance. I uninstalled it and a few days later I reinstalled it and now the performance of this test was like the ones I had before.

So what your saying is that you experienced the same thing?

As in you had bad performance when booting up GDevelop or your game but after restarting stuff ran better like what happened on the video?

And for anyone curious im running the latest update of GDevelop

My game is not very demanding in terms of graphics and resources. Generally on my PC it runs constantly at 60 FPS, but not on my cell phone. However, with the profiler I notice that there are times when the ms consumption in the profiler is much more than others, without any variation in the game. Even with these extra increases, it does not exceed the threshold for reducing FPS.
Yesterday, the game had a bit of lag. When I restarted Gdevelop, it worked better. The funny thing is that it happened to me on my cell phone with a build too.
I suggest you use the debugger profiler to know in which section the increase in resource consumption is. Pay attention to the rendering section.

My game isnt exactly very demanding either, its not like im generating a big world with tons of objects or anything, its just a simple level.

Iv been sorting my events for optimal performance, to get as much out of it as i can, but it dosent matter when the engines just feels like starting to lag out for no reason.

and yeah… about the rendering… i was under the assumption that only objects in view of the camera were being rendered, but that dosent seem like its the case.

On the scene where the player needs to climb high with fireballs being generated at the bottom and being deleted at the top of the scene, the rendering on the profiler is way higher then on the rest of the scenes with no moving particle effects off screen.

Need to try more stuff out to improve, but surely theres got to be something more to it, the game isnt very demanding, its a light platformer… kinda disapointing if GDevelop cant handle a couple moving objects and a handfull of enemies…

Only the visible screen is rendered (there is a margin that renders a little beyond what the camera sees, otherwise it would happen that when you move the camera perhaps for a moment you would not see anything). I think your problem with FPS dropping (after restarting Gdevelop) has more to do with the horned enemies than just the rendering. The FPS drop is marked when they are on scene. Try removing them or placing them elsewhere in the scene and testing the performance.

Im fairly certain its just a software thing, most of the day the fps has been a solid 60 and then just because it went down to a solid 50, its just odd.

There are people who have reported that after several previews, the performance is affected. Have you tested if the exported game behaves the same way? (not the Gdevelop preview)

Yes the exported version does the exact same thing.

So the big thing to get out of this, or the “evidence”, that its a software issue, is what happened in the video.

The FPS was unstable, for as long as GDevelop was open, then i closed it, re opened and suddenly it was fixed.

This is the kind of thing that keeps happening, it feels like theres something odd with the memory.

It shouldnt be a machine thing since gdevelop makes games that can run on a web browser right? so the only real impact should be ram and internal memory as far as im aware.

My computer isnt some potatoe, its fine, it can run big ticket games, it should handle gdevelop game needs.

Yesterday after doing the bug report, the fps was solid 60, then later on out of no where it went to solid 50s, no real changes on events nothing impactful.

And heres something else:

  • I made all my events under one “main” event group.

  • On the profiler, last night when it was lagging out, it said that the events were at 5ms (or something), but the “main” event group where all events are under only showed 3.5ms, so… where the heck is the 1.5 extra comming from? it dosent say,

Its just weird man, even when i didnt optimize performance, the game some times ran on solid 60, some times it lagged down to 50s, after optimizing things to the point where only stuff on screen actually does stuff or plays sounds or whatever… still the same performance, some times 60, some times 50s

No clue whats up

I just noticed one more thing, maybe someone can explain this one.

Desktop GDevelop remembers your tabs even if you dont save the project before exiting the software.

Try it, open the Debugger, then close down GDevelop without saving and then reopen it… The Debugger will be there, its like some stuff is being saved to the cloud or being stored in memory for a while? idk…

Btw i save everything localy on my computer.

I have noticed that in some of my previews, the ms are higher than others without any difference that justifies it (they reach almost double the usual value). When I restart Gdevelop, it normaly return to the usual ms values ​​again. My game is far from the threshold of approximately 16 ms that needs to be exceeded for the FPS drop to be visible. I assumed it had more to do with a bug in the profiler than a problem in the game or Gdevelop itself, but I don’t know.

Just to be sure, are you using the FlexContainer Extension? They found out it had a memory leak and slowing down games on scene changes.

Other then that, i feel you, i have the exact same issue and im going nutts trying to figure it out…

Iv gone as far as to turn off literally every event that wasent on screen but it makes no difference, iv disabled most of them and still no difference…

Its something with the rendering i guess? …i even turn off every particle emitter thats not on screen…

gonna keep poking around today to see if i find anything else, if not ill just give up and assume its something engine related and wait for improvements…

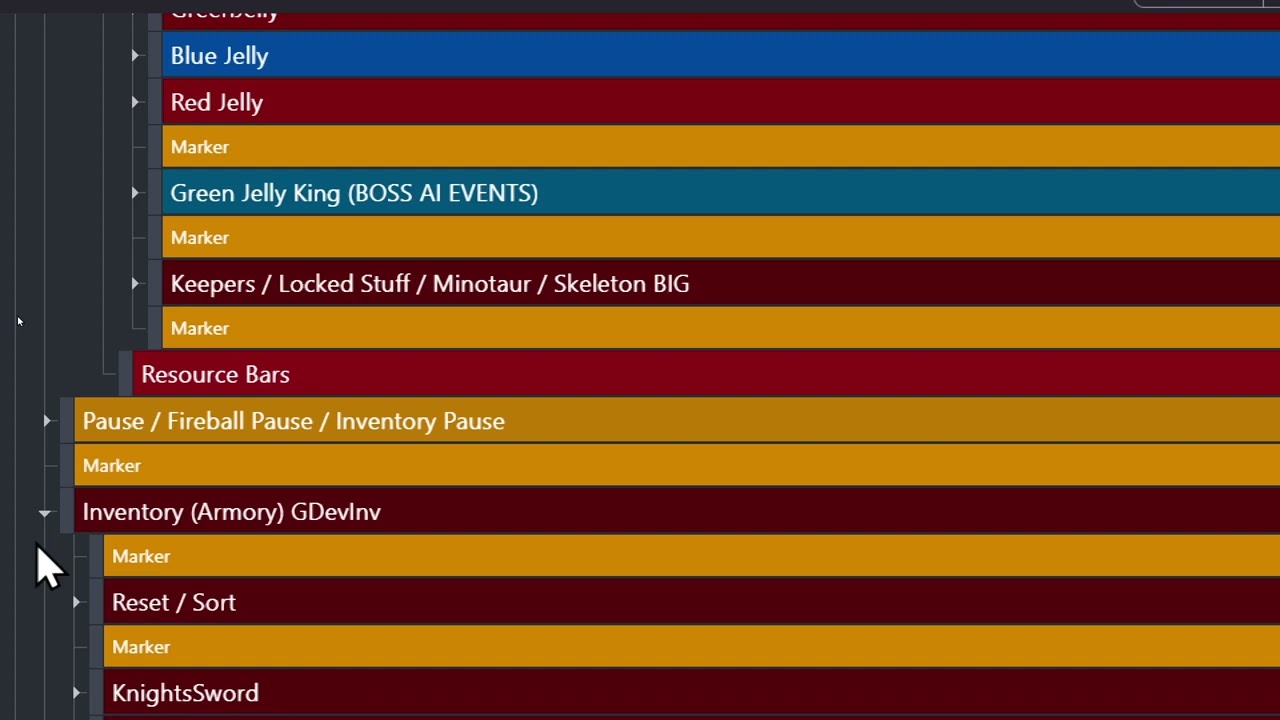
I just discovered that everything on the Event Sheet impacts performance, even simple “Comments” or Empty Events pile on the performance in a big way!

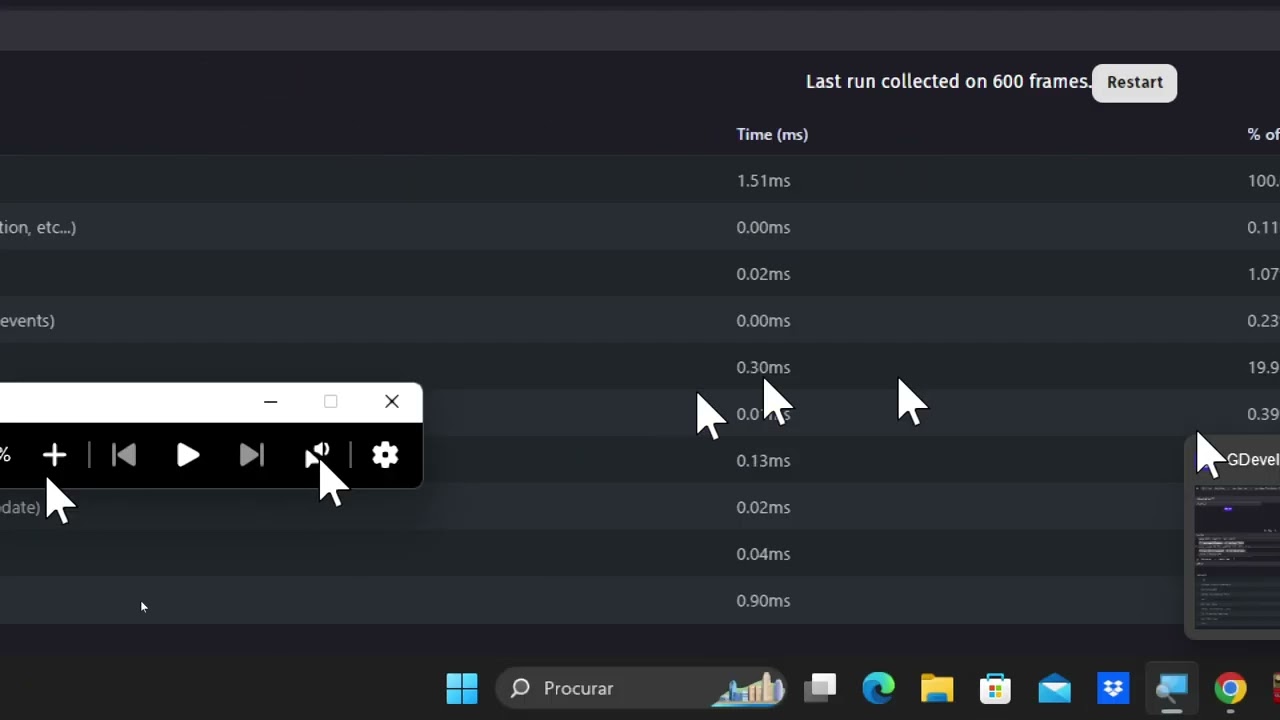
Heres my testing and proof, watch it through and youll see how just a handfull of comments and empty events add to an extra 0.30ms on a completly empty scene.

On my actual game, this extra performance can add up to as high as double the original events, in my case, and extra 2.50ms

Is this intended?

Just did some more testing out of curiosity and empty event groups increase your “ms” as well.

On the profiler, it said that the “Empty Event Group” was 0.01ms, while the “Events” was 0.14ms

I had 5 “Empty” event groups on the event sheet and nothing else.

I also did another empty scene test with just a single empty event and the events ms went up to 0.32ms

When the event sheet is empty, its always 0ms

The performance is all over the place with the results… Same everything, diferent results… its nutts…

No, I have very few extensions and nothing about that.

You’ve done a great job with all of this. Thank you!

I’ve mentioned a few things about this on the forum but didn’t get an official response (Lower performance on different previews ,also Android Performance Issue even with 2 Simple Small Physics Objects). I had no idea that empty events consumed resources.
What confuses me is that you have around 0.70 ms of rendering on an empty screen. I think there must be some weak point in the rendering.

I just cant seem to figure it out, no matter how much i optimize its all over the place, some times it runs at 9.00ms total, some times its at 16.00ms total… for no reason…

The render is one of the things that has the odd changes, along with the objects pre events and then the “Events” that we cant see.

Tomorrow if its still going all over and i have the patience, ill try deleting all the markers, debug tools i made and everything thats not “code”, to see if it makes a big difference.

New UPDATE!

I got rid of all junk from the Event Sheet, all Comments, “Markers”, junk events that were disabled, everything that wasent a part of the game right now, i deleted.

The result was a big increase in performance…

For clarification… i must have deleted over 100 Event Comments i was using as markers, along with a bunch of disabled things i had as experiments.

Getting rid of the junk really made a difference… but the event groups make a difference too, sadly those are harder to delete since they keep everything sorted…

I have a bunch of those too… so sad times…

Theres still a full 1.00ms between my “Real” events and the “Events” tag on the profiler.

Another difference that i saw was on the Task Manager and Memory usage…

Before i deleted all the junk comments, the memory was around 850MBs to 900MBs

Now after getting rid of all that stuff, it sits around 500MBs of memory being used.

Heres the new video of me testing stuff after deleting the comments:

If event groups affect performance then I am absolutely cooked, though I found that my game is unplayable on every browser and the in built preview, but is perfectly fine in firefox LAN preview. When I find time I’ll test to see if external events affect anything, that might be a good alternative to event groups.

Im not sure any more… think the problem is some where else and its an engine issue.

I just booted up and now everything is upside down in terms of performance, its gone back to being bad with literally no change what so ever…

Ill post the testing in a bit, the whole thing is just nutts…

And back to square one…

Last night, like you can see in the previous video, everything was fine, fps was good, it was all good…

This morning, not doing anything other then booting up… Its back to bad performance.

Please watch the whole thing, i got the Task Manager showing so you can see everything thats going on as i play test.

The memory usage from GDevelop is all over the place, Starting at 500Mbs, then going down to 250Mbs, then starting to go up and up untill it reaches the high 700Mbs… for no reason

I really dont get whats going on, its completly inconsistant with itself.